






 Telecommunications is one of the most dynamic and fast-developing industries in the world. Apart from market presence only, it’s highly important to follow trends and adapt to the constantly changing demands and needs of customers.
SC.Soft activity is aimed at providing the most relevant and effective solutions. We focus on the best expertise of other IT companies, offering our customers the most innovative and optimal solutions.
Our products include such important components as databases and monitoring systems. To ensure the safety and reliability of any service, it’s essential to use high-quality analytics. Today, in most of our developments we offer integration with Prometheus software for collecting system parameters, and further data visualization using Grafana.
In the era of microservices, support for multidimensional data collection is a particularly strong advantage, and here Prometheus acts as a highly effective tool. This software is suitable for diagnosing any high-load systems.
Each of its servers is autonomous, independent of network storage or other remote services. You can rely on it when other systems of your infrastructure fail: Prometheus effectively identifies trends in the operation of different resources — which services are used more often, which less frequently, and promptly reports on current or upcoming problems.
In combination with Grafana, Prometheus collects and stores its metrics as time series data, i.e. metrics information is stored with the timestamp at which it was recorded, and then visualizes statistics.
Prometheus itself can generate graphs using the tools on the page /graph, but Grafana is much more efficient. It’s convenient to create interactive and clear dashboards based on data from various sources.
What will the customer get:
A wide range of functional tools for creating informative graphs, charts, and tables for any task.
The page below shows the state of the Pacemaker cluster for SMS Router — you can consider in detail the quality of work of all services and machines in different infographic formats.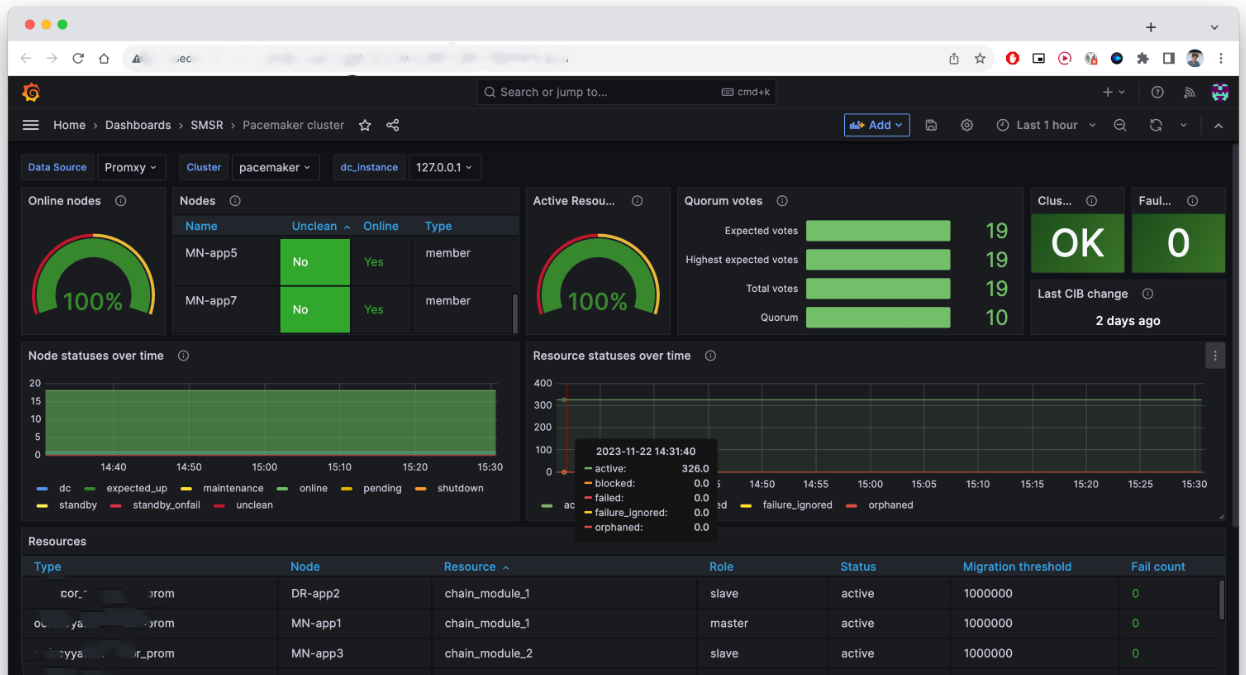
You can work with variables by changing the data display. The following screen shows the ability to switch the stage-production contour and view information on each one.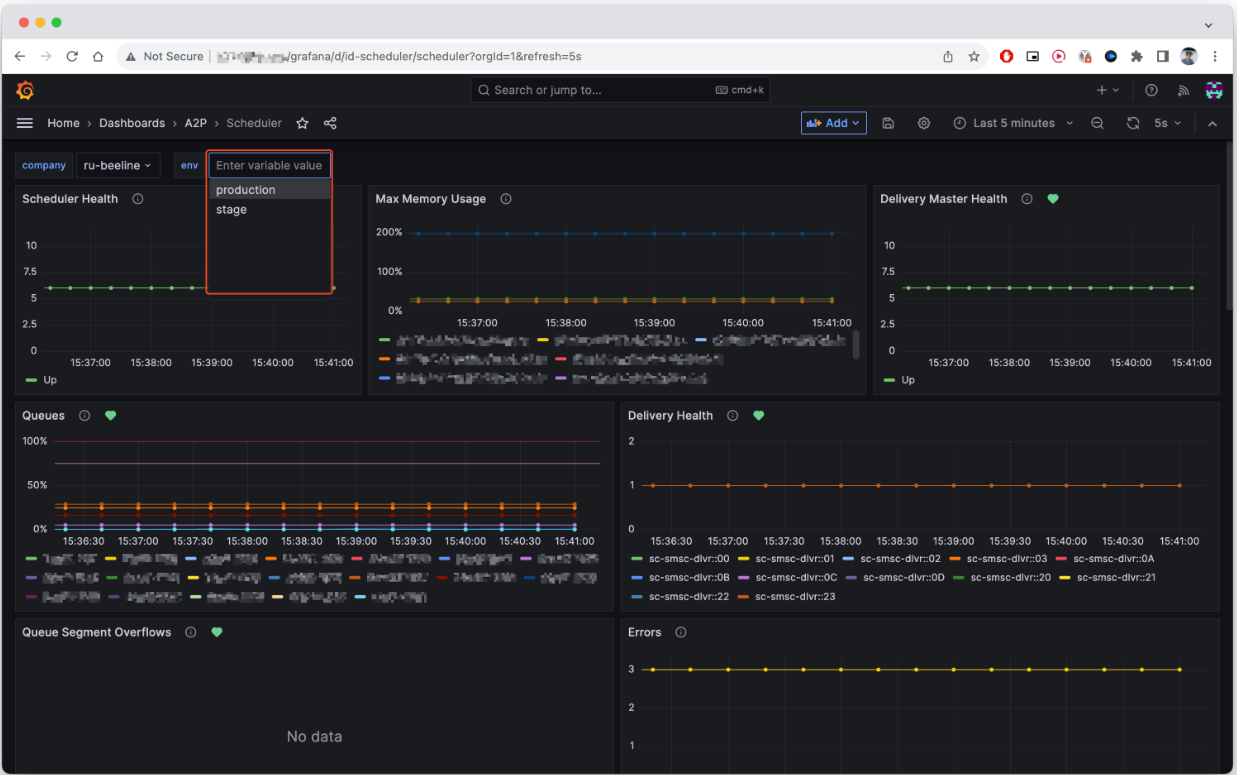
Dashboard for analyzing traffic from different providers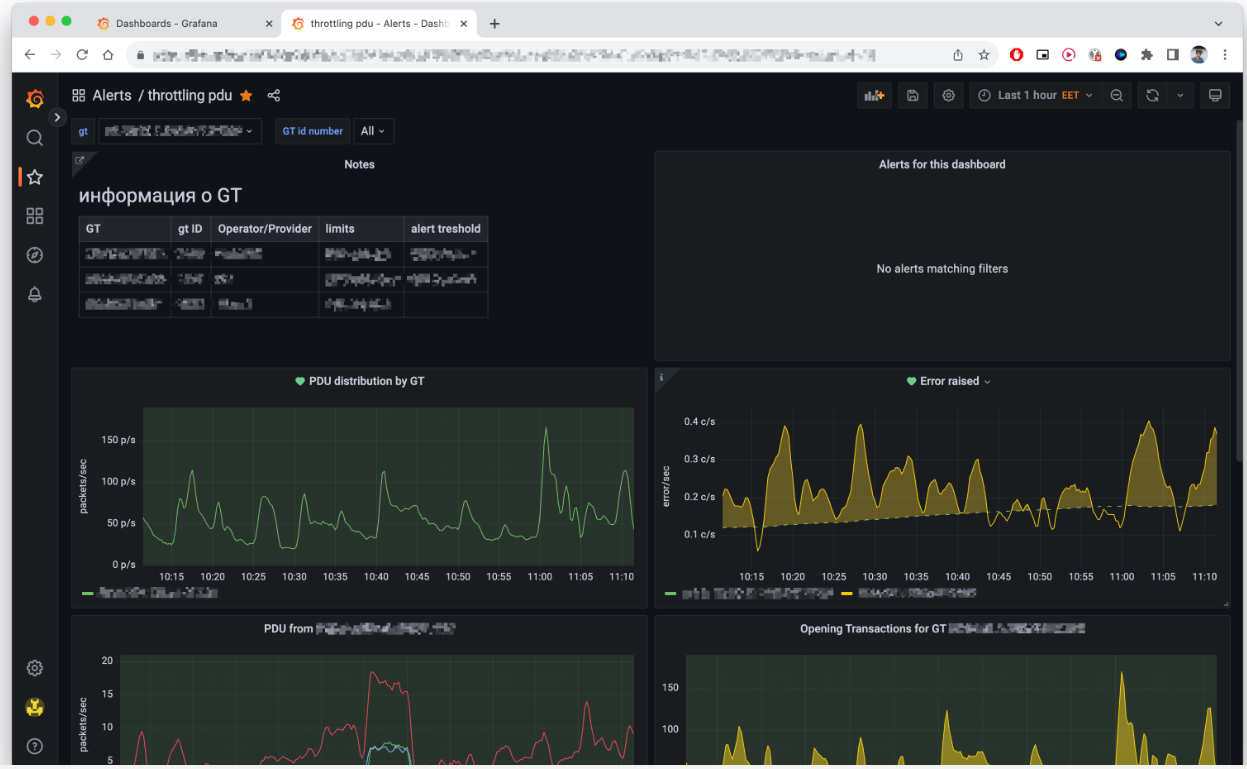
Real-time monitoring of key metrics and parameters, which allows you to quickly detect and solve problems, as well as predict failures.
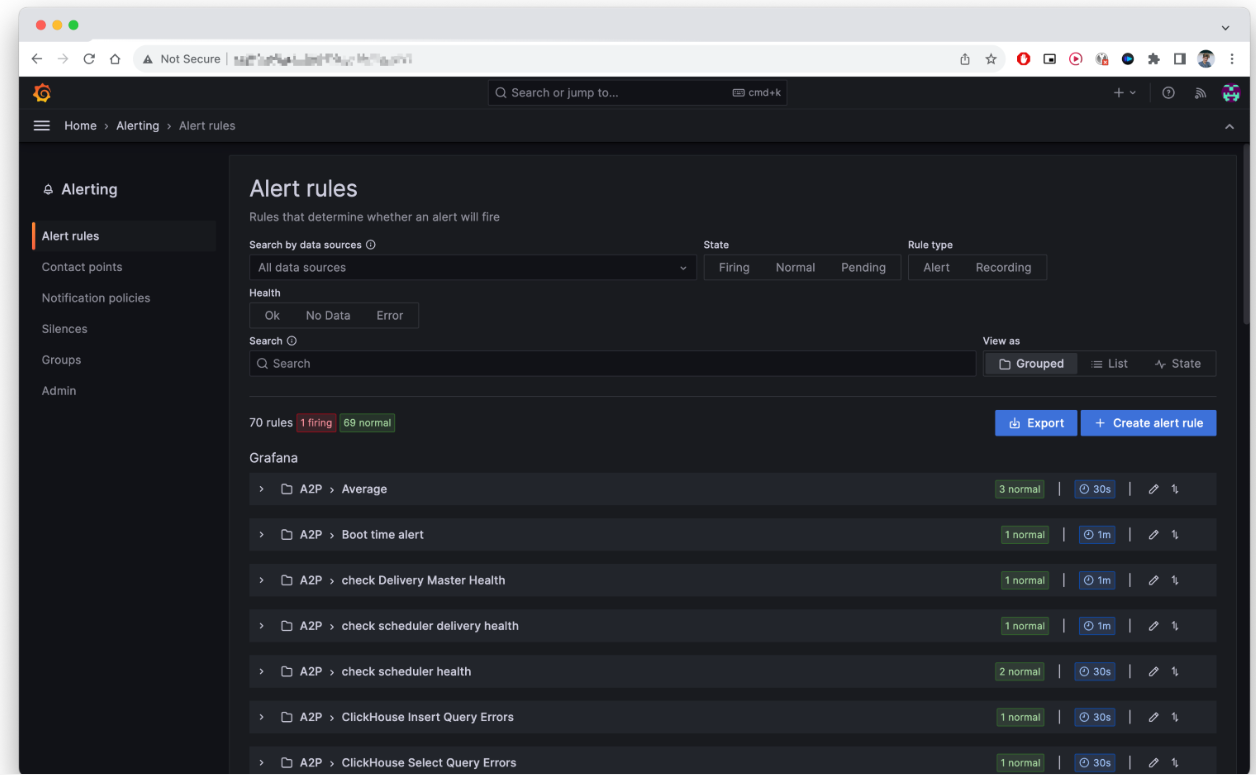
This page shows the groups of checks when adding a new platform. Alert rules is a system that helps to determine malfunctioning already taking place: 69 indicators of the system on the screen are normal, 1 is not.
The ability to integrate Grafana with various monitoring tools such as Prometheus, Loki, Elasticsearch, etc. This provides flexibility of the system, allowing you to choose the most appropriate tools for your infrastructure.
On the screen is a request from the Clickhouse database. You can quickly track how many messages were sent to a specific number over a specific period of time.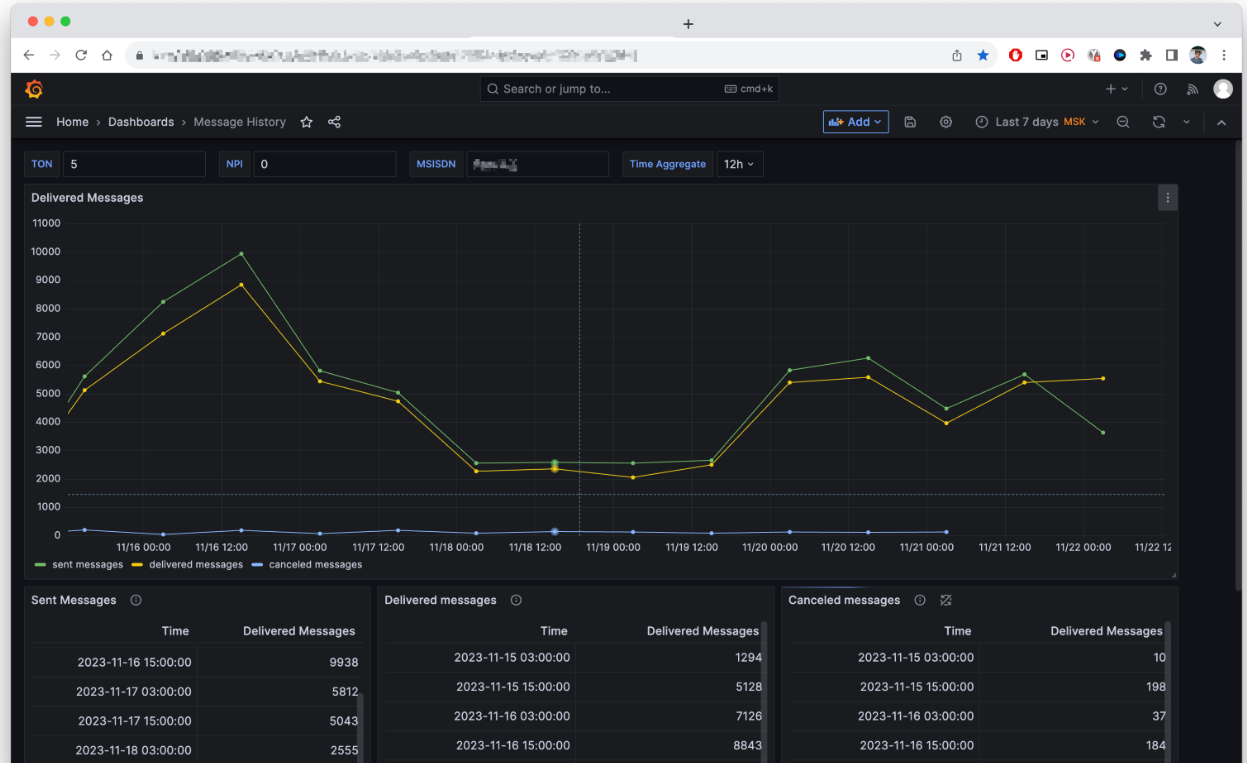
The urge to equip all products with the latest monitoring systems is about taking care of the services that work for you. To see the threat in time means to prevent a more costly recovery.
Unfortunately, not all existing monitoring tools are able to cope with the load of modern systems. Integration with Prometheus and Grafana is the best solution in this regard. When working together, these components perfectly realize each other’s potential.
These software products have been included in the package of the latest updates of SC.Soft products, such as Messaging Hub, and today they are automatically included in the database of our new products — P2P/A2P, SMSC and SMS Firewall.
